

The Library Director at a mid-sized law firm implemented our Director’s Dashboard as an online business intelligence tool that would make it easier to manage library operations without having to perform the same search, run repetitive reports, etc.
There were three objectives for the Director’s Dashboard:
- Answer key questions without having to manually create reports every week, month, or quarter
- Deliver real-time information on every area of library operations
- Analyze data to support collection management, vendor negotiations, etc.
The end result for this law firm was a dashboard that enabled the Library Director to answer 50 questions “at a glance.” The goal was that the Director should not have to perform a search or run a report in order to find updated statistics at any time; they achieved this goal with our Director’s Dashboard.
 While we think of “crunching numbers” when managing acquisitions, this implementation demonstrated that there is even more value in being able to see statistics related to requests. This client’s Director’s Dashboard reported on every area of the library—Acquisitions, Serials, Circulation, and Requests—but the area that received the most attention post-implementation was Requests. The library staff focused on providing a wide range of request handling services to attorneys, and as pioneers in measuring research services, they used the Director’s Dashboard to demonstrate exactly how the firm’s attorneys were using the library. Information generated through the dashboard enabled the Director to make evidence-based decisions about the collection, specific practice requirements, and training needs.
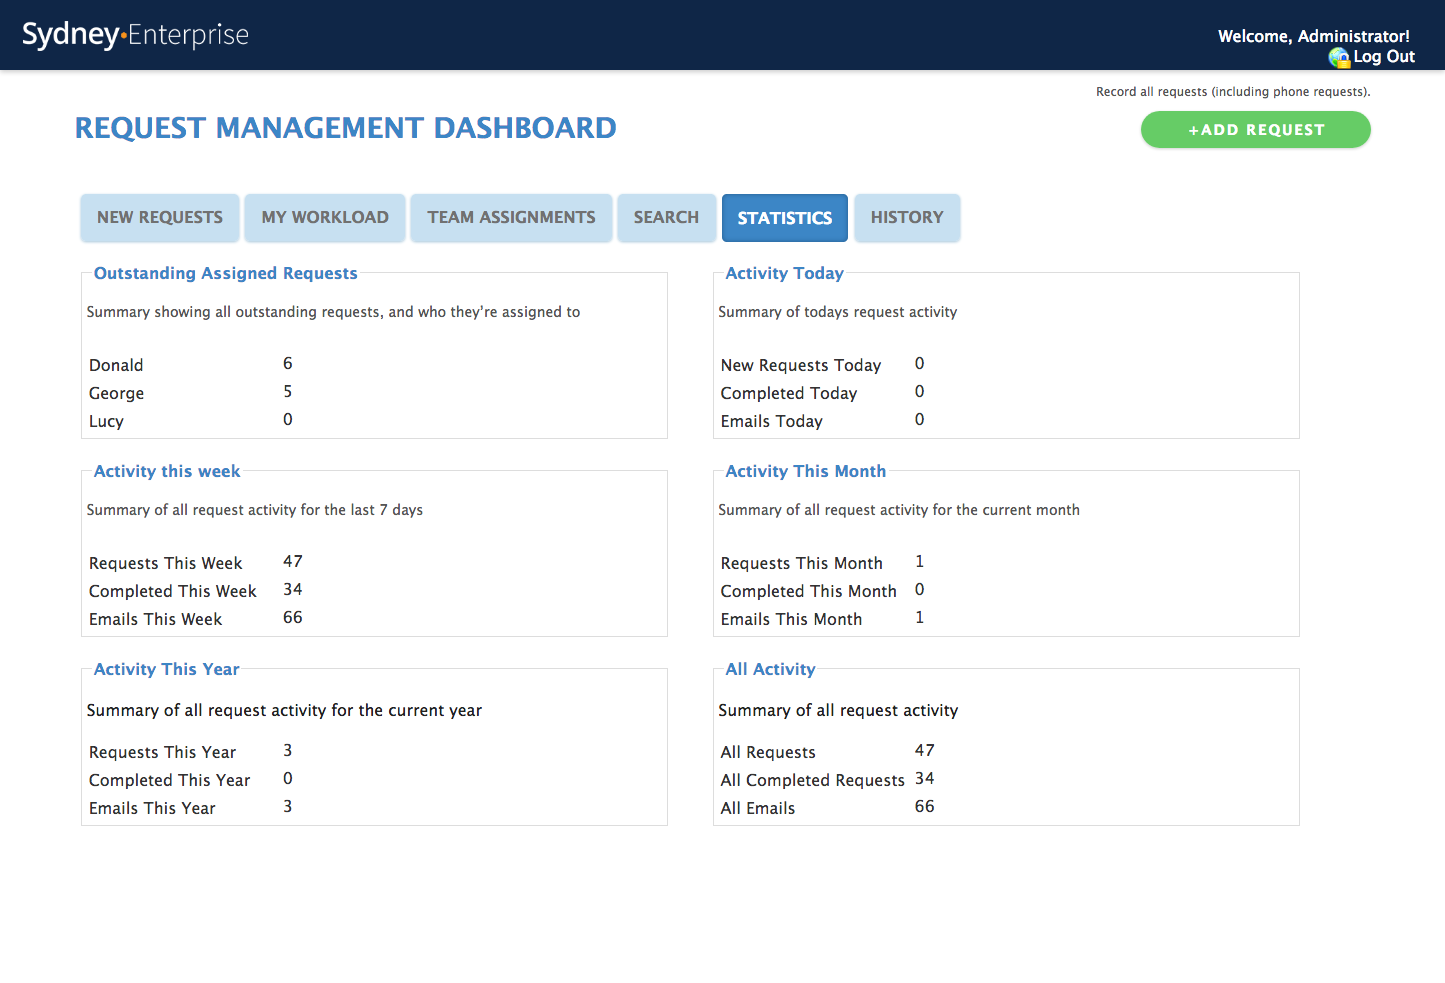
Our new SydneyEnterprise Request Management Dashboard further “bakes” analytics into the special libraries and KM “pie.” At a glance, you can see important information and statistics about your research service, and demonstrate to your management exactly how the library meets the needs of your organization.